Provider Productivity Benchmark Report
The Provider Productivity Benchmark Report provides the opportunity to measure provider productivity -- by service units or by payments collected within a given time range -- against your practice’s minimum threshold and threshold goal benchmarks. The report can be found in the Report Center.
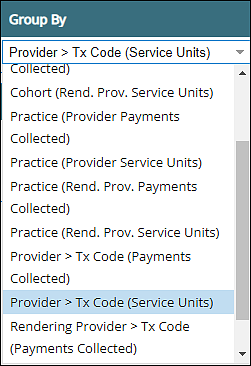
The report set has four groupings for reporting by service units and by payments collected:
- Practice
- Cohort
- Provider
- Rendering Provider
Practice
- Select the Service Date Range (Service Units and Payments Collected) and/or the Transaction Date Range (Payments Collected only) and click Run Report.
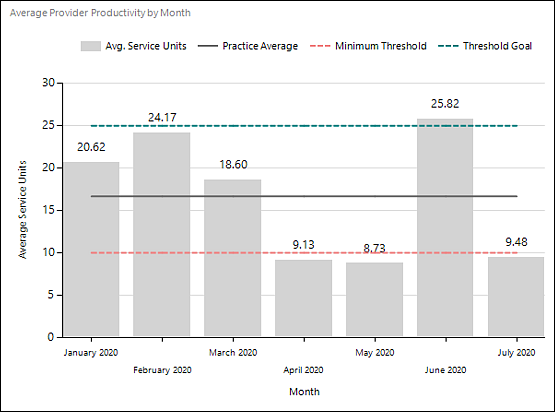
- In the Practice Minimum Threshold and the Practice Threshold Goal filter fields at the top of the report, enter the value for the practice-wide minimum average service units/payments collected per provider for the selected time range, as well as the practice-wide goal for average service units/payments collected per provider during the selected time range.
The report will populate a graph displaying practice-wide average service units/payments collected per provider by month. The Practice Minimum Threshold and Practice Threshold Goal values entered in the filter fields will appear on the report graph as dashed lines. The practice-wide provider average service units/payments collected per the selected time range will appear as a solid gray line on the graph. The table displays average service units/payments collected across all providers per month.
Cohort
- The Service Date Range (Service Units and Payments Collected) and the Transaction Date Range (Payments Collected only) are optional for this grouping. Once you click Run Report, a Year filter and Month filter will appear at the top of the report. The Service and Transaction Date Range filters will filter the Year filter, which in turn filters the Month filter. If no Service or Transaction Date Range is selected, the Year filter will list all years your practice has been active in Valant.
- To choose a cohort to analyze, select a list of providers in the Provider filter.

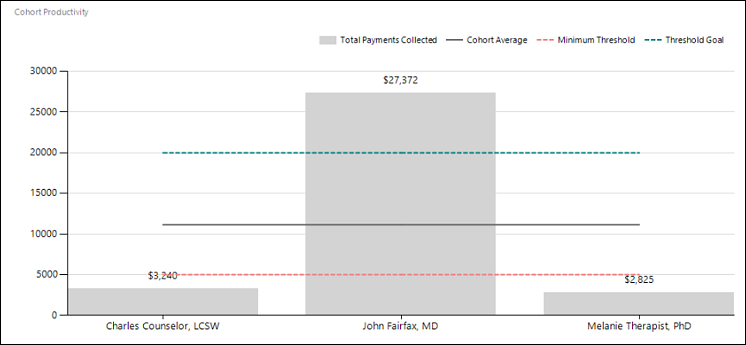
- In the Cohort Minimum Threshold and the Cohort Threshold Goal filter fields at the top of the report, enter the value for the cohort minimum average service units/payments collected per provider for the selected time range, as well as the cohort goal for average service units/payments collected per provider during the selected time range.
The report will populate a graph displaying total service units/payments collected for the selected time range per provider within the selected cohort. The Cohort Minimum Threshold and Cohort Threshold Goal values entered in the filter fields will appear on the report graph as dashed lines. The cohort’s average service units/payments collected per the selected time range will appear as a solid gray line on the graph. The table displays total service units/payments collected by provider per year.
Provider > Transaction Code
- Select the Service Date Range (Service Units and Payments Collected) and/or the Transaction Date Range (Payments Collected only) and click Run Report.
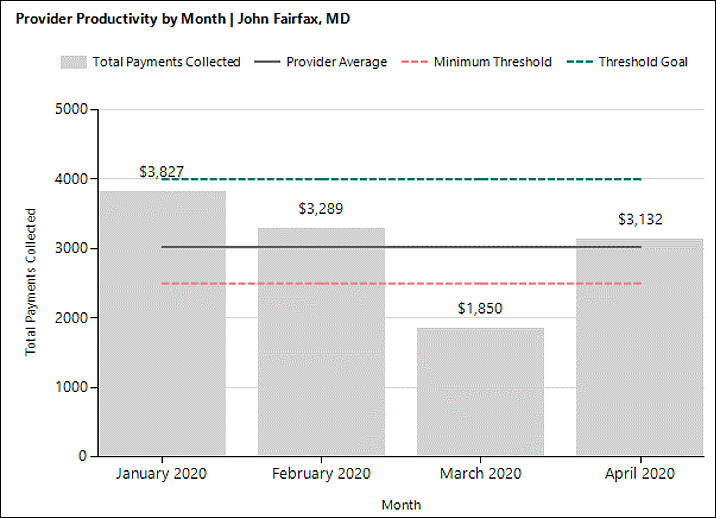
- In the Monthly Minimum Threshold and the Monthly Threshold Goal filter fields at the top of the report, enter the value for the minimum total service units/payments collected per provider for the selected time range, as well as the goal for total service units/payments collected per provider during the selected time range.
This report is paginated, with an individual provider per page. The report will populate a graph displaying total service units/payments collected for the selected time range by provider. The Monthly Minimum Threshold and Monthly Threshold Goal values entered in the filter fields will appear on the report graph as dashed lines. The provider’s average service units/payments collected per the selected time range will appear as a solid gray line on the graph. The table displays total service units/payments collected by the provider per transaction, grouped by month and year.
Note: The report chart must populate two or more bars (i.e. Practice and Provider > Transaction Code groupings must have at least two months selected, and cohort grouping must have at least two providers selected) in order for the minimum threshold and threshold goal benchmark lines to display on it.