Outcome Measure Reports
In the Report Center there are Outcome Measure Reports to view score reports for clinical outcome measures. This will allow practices to better understand client scores and improvement over time.
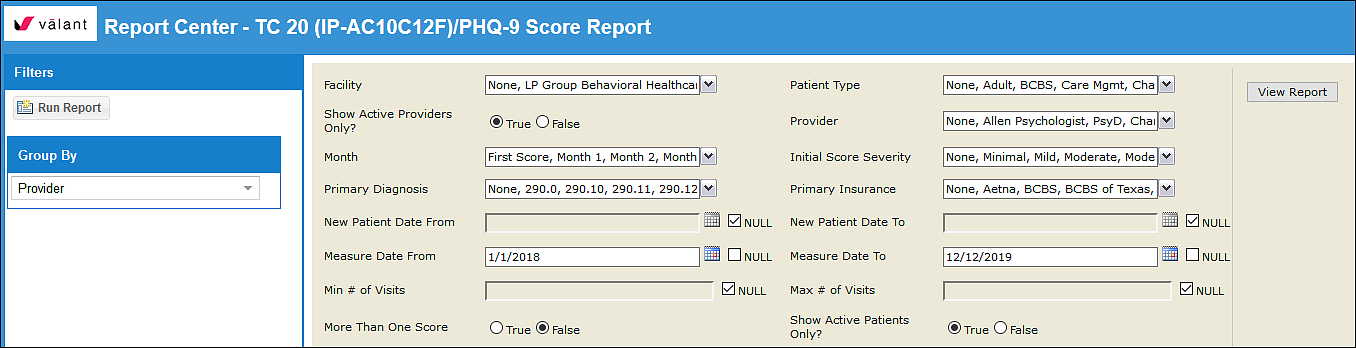
To access these reports open the Report Center, click the "Clinical" category and select the specific score report. Each of the report scan be grouped by provider or facility and specific parameters can be set. This report is available for the following measures: Gad-7, OASIS, PHQ-9, PSC, and Y-PSC.
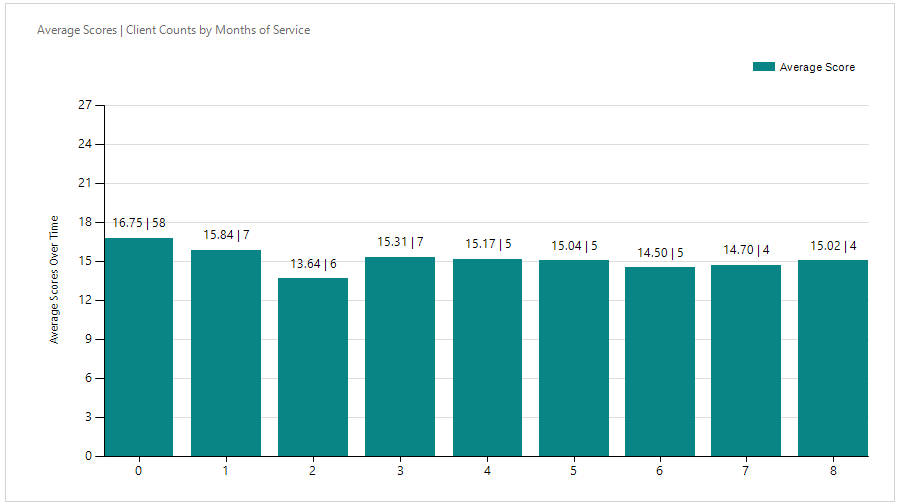
The report includes two bar graphs and a table that will show the data based on measure results within the parameters. The report will show data for the score range of the measure, for the PHQ-9 that is on a scale of 1-27. The first bar graph will show the average score, and number of clients that factored into the average, per month of service.
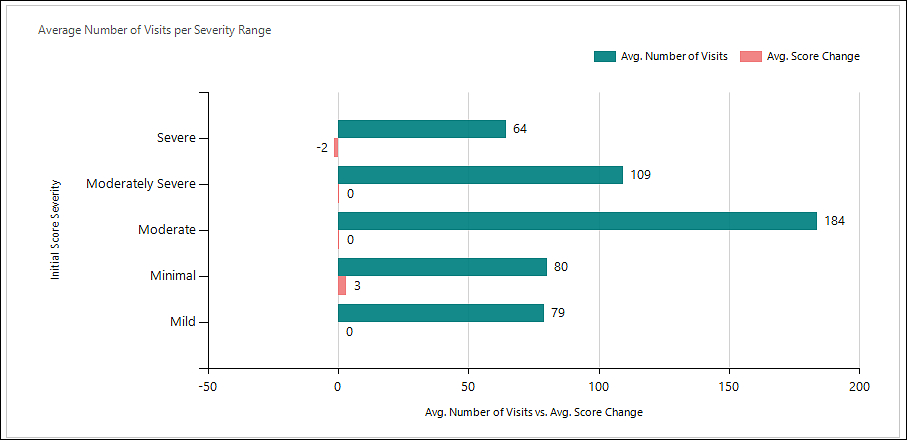
The second bar graph will show the average number of visits and average score changes per initial PHQ-9 score severity range.
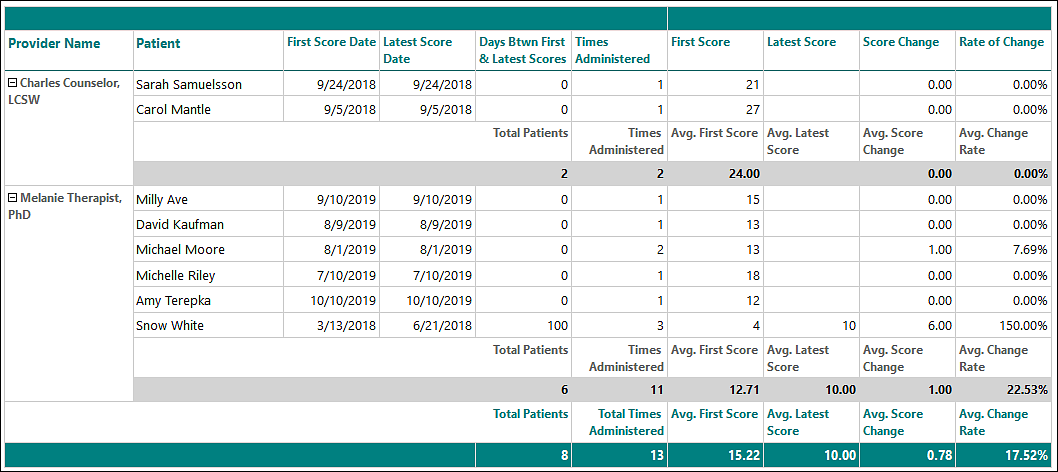
Included in the report is a table the will display totals for all selected providers or facilities.